
PC Performance Guide
Understand startup delays, storage pressure, and memory load.
A simple educational visual guide explaining Task Manager resources, CPU and memory load, temporary files cleanup, SSD speeds, and thermal management.
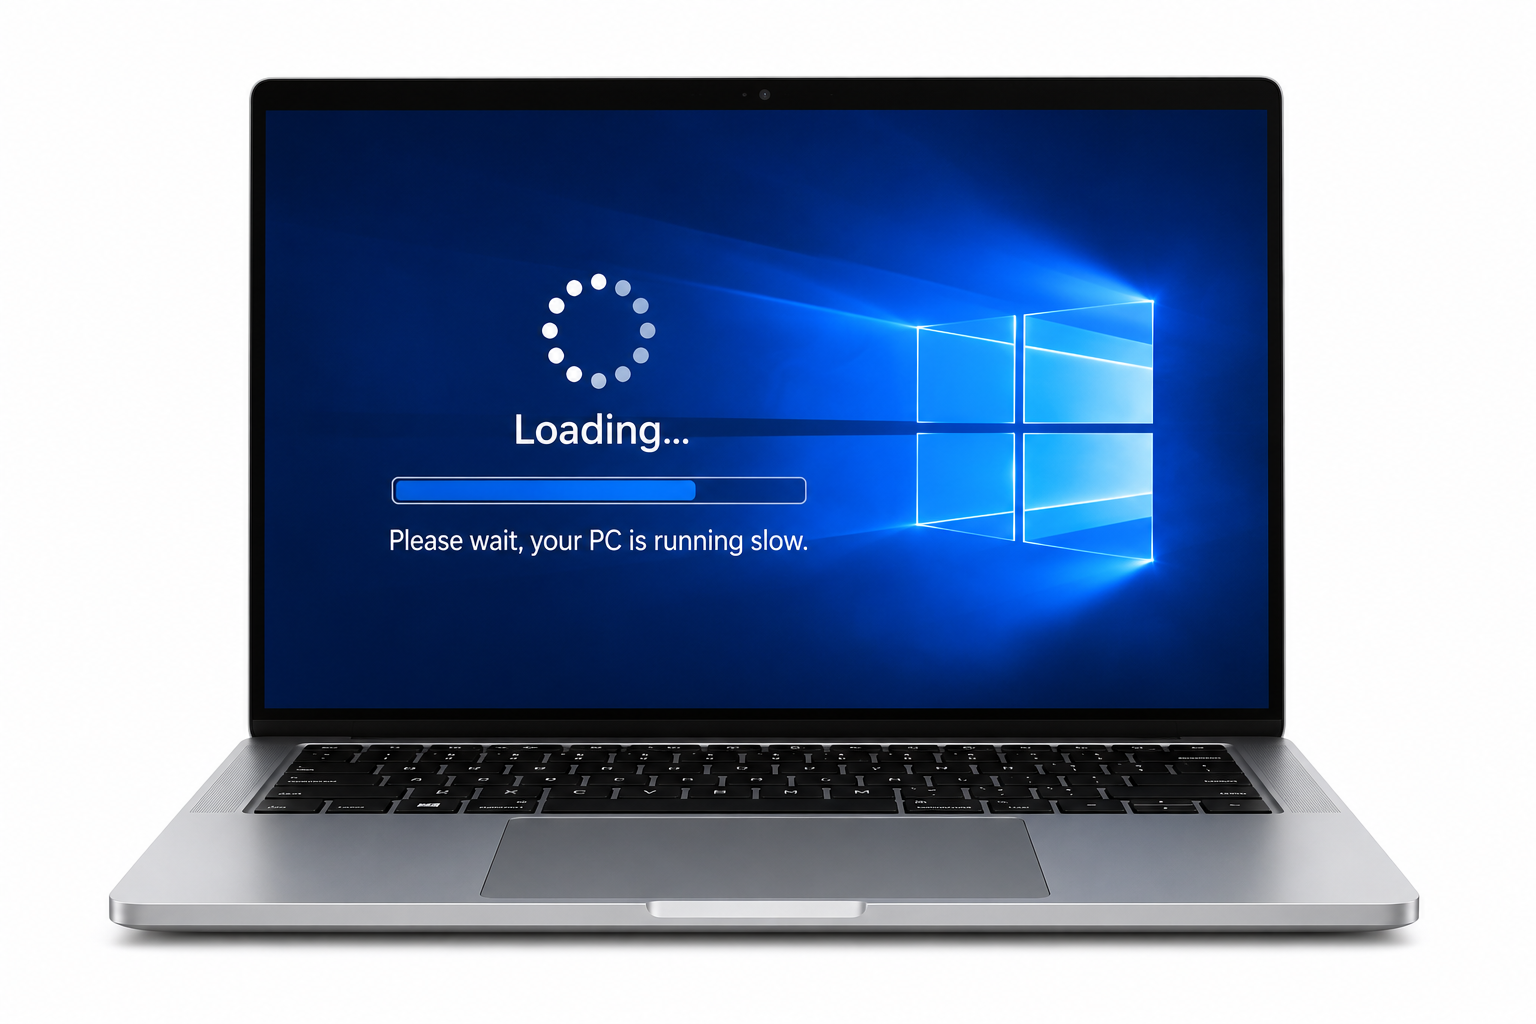
Match the screen with the PC situation.
These examples explain common Windows warning screens in a learning context, so readers can understand what the message usually points to before reading the detailed guide.
High CPU Usage
Task Manager shows CPU or Memory at 90-100% with freezing. This usually means a background application or updates service is locked, consuming maximum system cycles.
Low Disk Space Alert
Red storage bar showing on C: drive in File Explorer. This means available system space is too low to handle temporary virtual memory operations properly.
Heavy Startup List
Multiple apps open automatically right after Windows boot. This increases boot times because the processor is opening non-essential apps before loading the main desktop.
System Fan Noise
Hardware fans spinning loudly and continuously under load. This happens when the CPU is running hot and automatically slows itself down to prevent damage.
Page File Lag
System slows down when opening multiple heavy browser tabs. This indicates physical RAM has filled up and Windows is using the slower hard drive space as virtual memory.
Disk Active Time 100%
Disk active time in Task Manager spikes to 100% without active file transfers. Mechanical drive platters struggle to read fragmented files, locking system tasks.
Where users usually check PC resources.
Task Manager dashboards, cleanup utilities, and active system services are key checking areas in Windows.
Task Manager
The Windows diagnostic dashboard showing active resource usage for CPU, Memory, Disk, and Network channels.
Disk Cleanup / Storage Sense
Built-in cleanup utilities that target temporary browser files, update caches, and empty recycle bins safely.
Services App
The Windows services manager where background program startup types (Automatic/Manual/Disabled) are set.
PC performance basics
Before understanding freezing screens or low space alerts, it helps to understand resource architecture. Computers require balanced CPU/RAM allocation, fast storage files fetching, and proper cooling.
CPU & RAM Allocation
Processor cores compute active app tasks, RAM holds short-term application instructions.
SSD vs HDD
Solid State Drives read files instantly; mechanical Hard Drives spin magnetic platters slowly.
Thermal Management
System cooling safety protocols that throttle processor speeds to cool hardware down.
Common signs users may notice
These signs usually appear before users check Task Manager or run cleanup diagnostics.
Mouse cursor lag
Cursor freezing or stuttering across the active desktop interface.
Delayed boot times
Windows taking several minutes to reach a ready desktop state after boot.
Low storage alerts
Operating system alerts telling users to clean space on system partitions.
Application crashes
Unresponsive app threads closing unexpectedly without saving files.
Start with simple visual guides.
These guides explain common learning areas for system optimization with clean flow, simple wording, and visual step-by-step images.
Slow System Performance
4 essential visual steps to identify and eliminate the primary causes of system slowdowns.
Low Disk Space
4 visual steps to reclaim valuable storage space and prevent errors caused by full system drives.
High CPU & Memory Usage
4 visual steps to diagnose and resolve high resource consumption that causes system lag.
What system resources do
Your computer is a multi-threaded manager. When applications open, CPU executes thread commands, RAM stores active operational data, and SSD/HDD physical storage tracks long-term data files. Mismatched resource allocation slow down operations.
PC performance facts
Clean drives optimize RAM swapping
Keeping at least 15% C: drive space allows Windows to cache temporary virtual memory pages efficiently.
Disable startup app overload
Turning off automatic startup launches cuts boot-cycle delay times significantly.
RAM upgrades allow multi-tasking
Adding RAM modules prevents resource conflicts when running heavy browser tabs.
Quick checklist
This checklist is for learning and awareness only. It helps readers understand the common order in which PC performance topics are usually reviewed.
Check Task Manager resources
Identify CPU, Memory, or Disk spikes running under active tasks.
Disable startup app programs
Disable heavy non-essential apps from automatic boot-launch list.
Run Disk Cleanup utility
Delete temporary installation, system log, and browser cache bytes.
Audit C: Drive available space
Ensure at least 15-20% available partition quota space remains.
Check system operating temp
Verify vent clearance and clean dust blocks to prevent throttle down.
Verify no background updates are active
Windows updates running background installs can block drive access.
Status meanings
Disk active time 100%, RAM swapping, thermal throttling, and unresponsive tasks are different diagnostics. Each phrase points to a different system resource condition.
Disk Active Time 100%
The system drive is working at maximum read/write rate limit, stalling other operations.
RAM Swapping
Active RAM memory has filled, forcing Windows to use slower drive space as virtual memory.
Thermal Throttling
The CPU decreases its speed limits automatically to cool down hardware heat levels.
Unresponsive Task
A software thread is locked, failing to process instructions or release resources.
Detailed explanation
Why system slowdown alerts appear
A computer does not run as a single isolated device. It relies on synchronized hardware resource operations. The OS schedules processor clock cycles, RAM manages application pointers, and physical drives read file sectors.
When a computer lags, it is reporting that resource scheduling has hit limits. The CPU may be running fine, but a single software loop could be blocking other tasks from getting processor time. Task Manager helps identify these program locks.
Drive speeds affect virtual memory performance. While SSDs manage virtual page file caching quickly, HDDs struggle with mechanical platter seek times. This platter lag triggers high active disk times and locks.
Storage quotas and thermal throttling add other operational layers. Low system drive partition space blocks temporary file expansion, while heat accumulation inside laptop vents triggers hardware slowdown protocols.
Common questions
PC performance FAQs. Explore typical questions about slow boots, disk usage, and resource monitors.
This page is for learning PC performance concepts.
Your Good Guide provides educational reading only. This page does not offer live support, phone support, remote access, repair service, driver installation service, or paid troubleshooting.
Live Help
No phone support
Diagnostic
No remote access
Software
No software sales
Verification
Official sources linked
Continue learning
Learn more driver concepts. Explore related educational guides about audio, graphics, network, USB, chipset, Bluetooth, and other driver topics.